Competence · Test methods

Five methods. One platform.

Scientifically founded. Series-proven. From noise and material testing via modal test to order and modulation analysis.

Shared foundation

From signal to decision

Whether noise, material or process – every test task runs through the same three stages. What follows applies to all five methods.

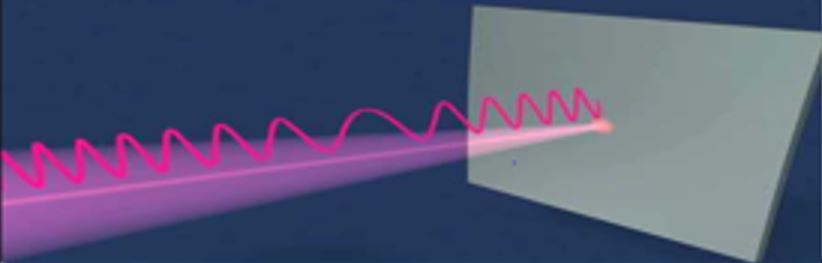
Illustration: a laser beam hits a surface, the returning wave illustrates contactless vibration measurement
01

Measure

It starts with the signal. Piezoelectric accelerometers capture vibration in contact, laser Doppler vibrometry (LDV) does so without touching the part, microphones pick up airborne sound. Sensor choice, measurement direction and measuring point decide whether a result is reproducible – long before any analysis runs.

  • Piezoelectric accelerometers for contact measurement
  • Laser Doppler vibrometry for contactless measurement at hard-to-reach spots
  • Measurement in horizontal, vertical and axial direction at defined points
  • Microphones for airborne sound, accelerometers for structure-borne sound
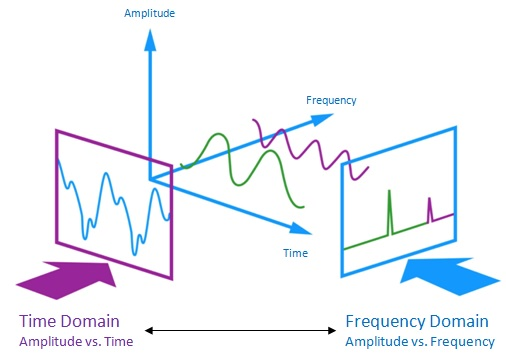
Diagram: the same signal in the time domain (amplitude over time) and in the frequency domain (amplitude over frequency) with its spectral lines
02

Analyse

Electrical, acoustic and mechanical signals carry more information than a single limit value can express. First, signal processing reduces noise. Spectral analysis breaks the signal into its components, frequency analysis identifies characteristic frequencies, and time-frequency analysis additionally captures when something changes. Pattern recognition finds recurring events, correlation analysis reveals relationships between several signal sources.

  • Noise reduction and filtering of noisy raw signals
  • Spectral and frequency analysis to identify characteristic frequencies
  • Time-frequency analysis of non-stationary processes
  • Pattern recognition of recurring events in the signal
  • Correlation analysis across several signal sources
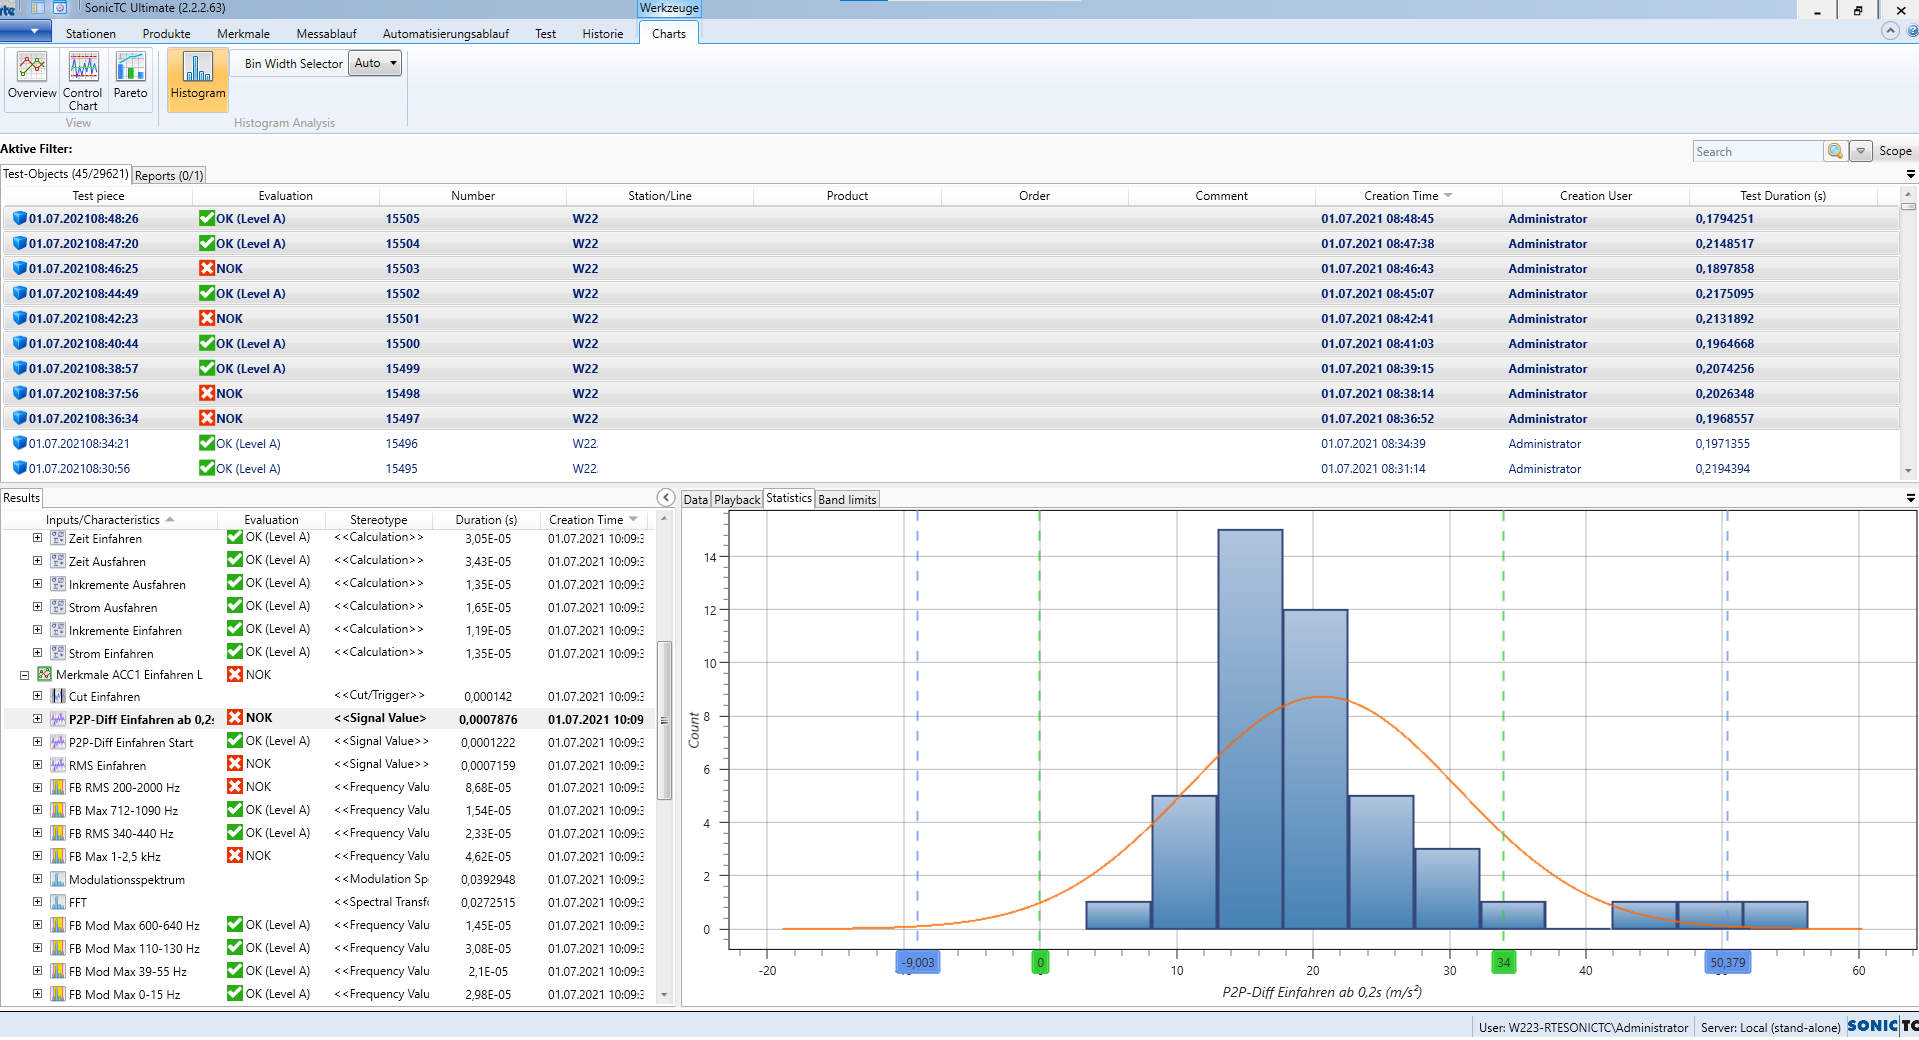
SonicTC characteristic configuration: result list with OK and NOK verdicts alongside a histogram with normal distribution curve and marked band limits
03

Evaluate

Pass/fail sounds simple – until the limit has to be set. Too tight and good parts fail; too wide and bad ones pass. In SonicTC, specification limits are derived from real measurement series through graphical signal analysis and characteristic configuration, then validated statistically. A stable manufacturing process is the precondition; often the results have to be normally distributed. Whether they are shows up in the visualisation during configuration – not after the first production day.

  • Pass/fail classification against specification limits (OK / NOK)
  • Graphical derivation of limits from real measurement series
  • Statistical validation of the limits that were set
  • Checking the normal distribution assumption during configuration
  • Evidence of a stable manufacturing process as a precondition

Ready to experience acoustic test technology in your line?

Send us your part or schedule an online demo. First assessment within 24 hours.

Or call directly: +49 721 94650-0
Call Request feasibility