
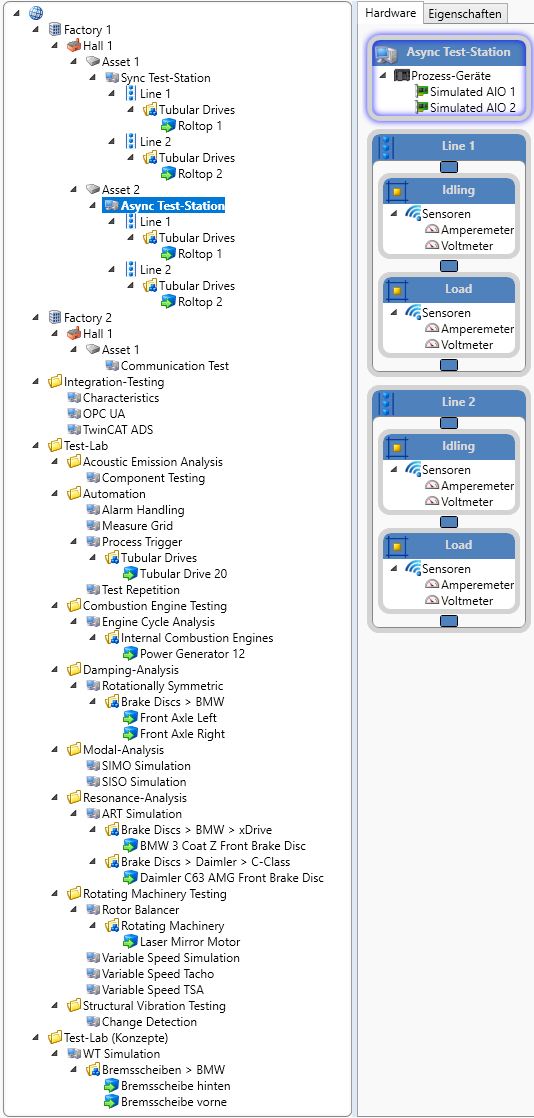
28 test projects ready to try.
Most examples run without measurement hardware: signal generators, signal imports and simulated devices replace the physical measurement chain. Every configuration is provided as a .sonictc backup and can be imported through the SonicTC DbManager — individually or merged into an existing database.
SonicTC is the integrated measurement and test platform for noise and vibration analysis (NVH), spectral analysis methods on rotating machinery, material resonance analysis and process monitoring. The example configurations presented here demonstrate the scope of the platform using complete, runnable test projects.
Most examples run without measurement hardware: signal generators, signal imports and simulated devices replace the physical measurement chain. Every configuration is provided as a .sonictc backup and can be imported through the SonicTC DbManager — individually or merged into an existing database.
Line & station configurations
These examples show how SonicTC organises test lines with several fixtures — from synchronised cycle operation to decoupled parallel testing with workpiece carriers.
Line configuration with synchronous fixtures
Two test lines with two fixtures each operate in a common cycle: the main workflow of each line calls the idling test and the load test one after the other in a loop. In every test step the product variant is selected through the product chooser, current and voltage signals (ammeter, voltmeter) are measured through a simulated analog I/O and the results are stored. Two product variants demonstrate product-related result storage.
Station: Async Test-Station SimulationLine configuration with asynchronous fixtures
The counterpart to the synchronous line: the four fixtures (idling and load per line) run independently in their own loops — one test object passes through both fixtures of a line while the next one is already being processed in the other. The load test additionally increments the test object number on every run. Current and voltage signals are measured through a simulated analog I/O, with product selection through the product chooser.
Station: WT Simulation SimulationWorkpiece carrier configuration with workflow versioning
Demonstrates workpiece carrier integration with product-specific characteristics and workflow versioning, using brake components as an example. Six product variants (brake discs and brake calipers) are set up and can be assigned two separate characteristic sets. The measurement sequence acquires sound pressure and temperature in a loop; the characteristic calculation covers FFT spectrum, frequency position, signal filtering, peak counting, signal section, crest factor and RMS. All workflows are versioned (version 2 with a version comment); two configured alarms round off the example.
Automation & sequence control
Alarm system, test repetitions, online evaluation during the measurement, operator dialogs and closed-loop control — these examples show the sequence control of SonicTC.
Alarm handling, A-B-C evaluation limits & noise metrics
Shows the SonicTC alarm system bundled into one workflow: an acceleration sensor is measured cyclically, then the noise metrics SNR and SINAD are calculated as characteristics and checked against graduated evaluation limits. Depending on the result the sequence raises either a warning or a critical alarm with dynamic message text. The error flow demonstrates automatic reactions to alarms: restarting the sensor on poor data quality and a PLC warning on high database load.
Station: Test Repetition SimulationTest repetition & test sections
Demonstrates repeat measurements and test sections using a vibration test with two directions of rotation (CW/CCW). Two structurally identical test section workflows each measure the acceleration signal in a repeat loop and calculate the RMS value — repeated until evaluation == Good is reached, but no more than three times. The measurement signals of every repetition are stored, but only the last characteristic results; the number of repetitions can be shown in the characteristic result tree (permanently as well, through "Expand all characteristic result nodes"). Because both test sections call the same characteristic workflow, the option "Show call paths" is recommended. A control workflow synchronises the sections through ready/done signals; the error flows contain a reset trigger for a clean restart.
Station: Measure Grid From version 2.5.0.99 SimulationMeasure grid, signal trigger & continuous monitoring
Shows how a measure grid can calculate characteristics during a running measurement and react to them — here across a speed range from 100 to 300 RPM. A signal trigger on the speed sensor starts the acquisition; the measurement data is analysed statistically grid point by grid point (mean value, FFT), and a condition inside the grid detects when the target speed is reached. The screencast shows the visualisation in the test view (HMI/SCADA).
Station: DialogTest From version 2.6 No measurement hardwareCustomizable input and output dialogs
Demonstrates the customizable operator dialogs: formatted titles and messages, embedded images and several input fields in one dialog. The dialog service shows an input dialog whose result (Good/Bad/Cancel/None) is evaluated in the workflow; confirmed entries are passed on to a PLC. A parallel controller workflow drives the open dialog from the outside on a timed basis and shows a countdown — displayed values update automatically when a variable changes.
Station: Process Trigger SimulationMotor stop profile analysis with ramp & soak PID control
End-of-line test of a tubular drive with two test scenarios: stop profile analysis and limit switch testing. The load torque is simulated through a ramp & soak signal generator with PID follow-up control while torque sensor and rotary encoder are measured. After the motor stops under load, the sequence waits until the angle value no longer changes within a tolerance and evaluates overrun angle and overrun time as characteristics — entirely without an additional measurement task. The limit switch test derives switching states from current measurement signals.
Modal & FRF analysis
Frequency response functions, damping determination and impact hammer testing — from pure simulation to a real test cell with an automatic modal hammer.
SISO FRF analysis with repeat measurements
FRF analysis with repeated SISO measurements on a simulated system with three degrees of freedom: a modal loop generates and analyses a synthetic impulse and impulse response through signal generators. The characteristic calculation determines the FRF spectrum without exponential windowing (suitable for modal damping analysis), calculates the impulse response function and detects resonance peaks. A special feature: the quality factor is determined with five methods in parallel for comparison — after Ewins, rational fraction polynomial (RFP), x-dB, v-dB and circle fit.
Station: SIMO Simulation SimulationSIMO/MIMO FRF analysis on 8 geometry nodes
FRF analysis on eight geometry nodes of a structure: for every node a node loop generates and analyses a synthetic impulse and the corresponding impulse response of a 3-degree-of-freedom system. The characteristic calculation determines the FRF spectrum, detects resonance peaks and calculates the quality factor as a damping value. The setup can be used as a SIMO or a MIMO analysis.
Station: FRF Test Physical hardware: NI-9234, Maul-TheetFRF impact hammer analysis with repeat measurements (NI-9234)
FRF analysis with an automatic impact hammer and data acquisition through a National Instruments NI-9234 module. After an optional setup step — move the hammer position, enter the excitation amplitude interactively — the series test runs: three impacts are performed per test part, force sensor and microphone signal are measured for each and the averaged frequency response function is calculated. The evaluation covers FRF spectrum, peak detection and loss factor; a decay time between the impacts ensures that structures have settled.
Station: FRF Test Physical hardware: PCB, Maul-TheetFRF impact hammer analysis with repeat measurements (PCB)
The PCB hardware variant of the FRF impact hammer analysis with an identical test sequence: setup mode, series test with three averaged impacts, FRF evaluation with peak detection and loss factor. In addition this configuration contains a calibration sequence for the measurement microphone that checks RMS level and frequency position at 1 kHz against a calibrator, plus an extensive product list with more than 50 entries in several categories as an example of product management.
Station: Mobile Physical hardware: Beckhoff CX7000, NI-9232Mobile impact hammer test (Beckhoff CX7000, NI-9232)
Mobile sound test stand with physical hardware: a Beckhoff CX7000 controller and an NI-9232 measurement module with a microphone. After the hammer blow the microphone signal triggers the measurement; RMS and FFT are calculated and the spectral maxima in three frequency bands (2–3 kHz, 7–8 kHz, 14–15 kHz) are evaluated. A life bit mechanism monitors the connection to the controller in parallel and raises an alarm if it fails. A screencast of the configuration is available.
Station: FRF-Messzelle Physical hardware: Beckhoff EL7031Modal analysis with stepper motor positioning
Automated modal analysis on a cube test specimen with stepper-motor-controlled positioning (Beckhoff stepper motor terminal EL7031). After every measurement run the specimen is rotated by one increment through a motion controller task so that several geometry points are excited and measured one after the other; when finished, the motor returns to the zero position. The characteristic calculation is based on FRF spectra — as a single-channel variant and as a MIMO block for multi-channel evaluation. Operator guidance through LED output and a start button.
3 Stations Physical hardware: Maul-Theet, NV-Tech (SAM), Beckhoff EL7031, IVS-500Complete FRF test cell: modal test, damping & resonance analysis
The most extensive configuration bundles several variants of experimental modal and damping analysis in three stations. Force sensor, microphone and acceleration signals are measured under impulse excitation — either with a Maul-Theet impact hammer or an automatic NV-Tech modal hammer (SAM) — while a stepper motor rotates the specimen through several measurement positions; an IVS-500 laser vibrometer complements the sensor set. Damping is determined by several methods in direct comparison (ICF, Ewins, x-dB, RFP), including a coherence evaluation of the first mode. Also included are a purely simulated SISO FRF station and an alarm handling station with SNR/SINAD monitoring.
Resonance testing & structural monitoring
Non-destructive defect detection through acoustic resonance and modern decomposition methods for structural health monitoring.
Acoustic resonance testing (ART)
Non-destructive defect detection on brake discs through acoustic resonance testing: a microphone signal is acquired through a signal trigger and conditioned — band-pass filtering to produce a quasi-monofrequent signal, FFT and Hilbert transform. Two product variants have their own evaluation workflows that calculate damping ratio and frequency position of the resonances as characteristics; one variant additionally uses peak detection and envelope analysis. The product is selected inside the sequence through the product chooser.
Station: Change Detection SimulationStructural vibration testing & structural health monitoring
Demonstrates signal decomposition methods for change detection in structural monitoring. A signal generator creates a synthetic time series from trend, periodic and noise components, which is decomposed by three methods and compared directly: singular spectrum analysis (SSA) separates trend, two periodic components and noise; Hilbert-Huang transform (HHT) and discrete wavelet transform (DWT) each extract the trend component. The trend components are additionally evaluated through an envelope.
Testing rotating machinery
Unbalance analysis, order tracking at variable speed, time-synchronous averaging and modulation spectrum analysis — the classic methods of rotating machinery diagnostics. Beyond the examples shown here, SonicTC also supports modulation and modulation order spectra for detecting periodic amplitude modulations, for instance in gearbox and bearing diagnostics.
Unbalance force and phase estimation (rotor balancer)
Estimation of unbalance force and phase on a rotating motor from imported IR tachometer and vibration signals. The rotational frequency is determined in two independent ways for plausibility: through FFT with peak detection and through pitch analysis of the fundamental frequency. For the unbalance analysis both signals are band-pass filtered, mean-centred and scaled to the standard deviation; the cross-correlation yields the time offset through the lag position, which is converted into a phase shift in degrees.
Station: Variable Speed Simulation SimulationOrder analysis at variable speed (synthetic)
Order analysis with computed order tracking based on purely synthetic, non-stationary signals. Two sub-workflows represent run-up and coast-down; in both, speed profile and vibration signal are created by signal generators. The characteristic calculation covers STFT as well as order tracking with speed-synchronous resampling; the maximum of the 6th order is extracted as a characteristic from both the order-RPM map and the order spectrum.
Station: Variable Speed Tacho SimulationOrder analysis at variable speed (tachometer pulse signal)
Order analysis for run-up and coast-down based on an imported tachometer pulse signal: the speed (tacho RPM) is determined from the pulses through a calculation expression, the vibration signal is analysed through STFT and computed order tracking with speed-synchronous resampling. The results are an order-RPM map and an order spectrum, from each of which the maximum of the 6th order is extracted as a characteristic.
Station: Variable Speed TSA SimulationTime-synchronous averaging (TSA) on a fan coast-down
Calculates the time-synchronous average at variable speed in an application-like scenario: a desk fan is switched off at 2400 RPM and comes to a standstill in about 5 seconds due to air resistance. Tacho and vibration signal are simulated by signal generators. The characteristic calculation cuts a 2.5 second section out of the tacho signal, determines speed and pulse positions, calculates the TSA signal (corresponding to one shaft revolution) and transforms it through FFT.
Combustion engine analysis
Cycle analysis in the crank angle domain — engine condition diagnostics from the vibration signal alone, without a speed encoder.
Crank angle domain analysis (CADA) with speed estimation
Testing combustion engines from a laser Doppler vibrometer signal (LDV) alone, without a separate speed encoder: the vibration signal — recorded on the surface of one cylinder of a 12-cylinder large engine — is acquired through a measure grid and analysed directly during the measurement. The evaluation displays the cycles in the crank angle domain from −360° to +360°: rectification, signal shift and peak detection lead to the detection of the engine cycle, from which cycle events (for example the closing of intake and exhaust valves) and the speed can be derived. A screencast is available.
Station: Engine Cycle Analysis SimulationCrank angle analysis with parallel measurement
An extended variant of the crank angle analysis: the LDV signal is acquired continuously through a measure grid and analysed while the measurement is still running, while a second measurement and storage workflow is started in parallel through a workflow call. The configuration thus demonstrates parallel measurements on the same channel — both acquisitions run simultaneously, each with an embedded crank angle analysis.
Integration & communication
PLC and control system connectivity through OPC UA and TwinCAT ADS, serial device communication through RS232 and TCP/IP — including fully simulated counterparts.
OPC UA: read, write and observe
Reference example for OPC UA connectivity: an OPC UA server is started directly from the workflow, then an axis signal is used as a trigger, a velocity value is read, written anew and read again for verification. The example also shows how a sensor can be bound to a process variable and thus measured — for instance to convert a digital input signal into a time signal like a logger does. Finally the server is stopped in a controlled manner.
Station: TwinCAT ADS SimulationTwinCAT ADS: read, write and observe
The counterpart to the OPC UA example for the Beckhoff world: connectivity to TwinCAT through the ADS protocol with reading, writing and observing PLC variables. An ADS server is started from the workflow, several variables are read on a trigger, a rotary encoder signal is measured and validated through an RMS characteristic, then the server is stopped in a controlled manner. The communication runs entirely against simulated counterparts.
Station: Characteristics SimulationIntegration tests of the characteristic calculation
A collection of self-tests of the analysis engine: Parseval's theorem is used to verify that the time domain RMS matches the spectral RMS — for triangular and sinusoidal signals across three FFT variants with different windows and scalings. Further tests validate the envelope calculation on time signal and spectrum, the frequency position determination through PSD and STFT, and high-order IIR filters comparing the BA and SOS implementation forms with a conditional warning output on numerical instability.
Station: RS232 Kommunikation From version 2.6.0.54 SimulationRS232 communication in HEX format (datagram pattern)
Demonstrates RS232 communication in HEX format following the datagram pattern, using a PWM control unit as an example. A test workflow reads the processor ID as well as bootloader, application and parameter version block by block (in four chunks each across memory addresses) and writes back a test stand number; the telegram evaluation is done through RegEx patterns with CRC8 checksum expressions. A second workflow simulates the device completely by responding to every command telegram with the matching answer — runnable with two emulated COM ports, entirely without a physical device.
Station: Communication Test SimulationRaw communication through RS232 and TCP/IP
Demonstrates raw communication following the datagram pattern, using a scale as an example: a simulation workflow cyclically sends weight values as telegrams while the measurement workflow receives them on a trigger, captures them as a measured value and stores them. Both communication paths are set up as separate fixtures ("RS232" and "TCP/IP") so that the same sequence can be operated through either interface.
Import through the SonicTC DbManager — individually or merged into an existing database.
28 × .sonictc
Ready to experience acoustic test technology in your line?
Send us your part or schedule an online demo. First assessment within 24 hours.