
Data handling & data management
Every part has its story.
Test data turns into insight.
Seamless data capture creates transparency – and better decisions. SonicTC delivers the foundation for statistical process control (Cp, Cpk), Pareto, defect and correlation analyses directly from the test software.
A central data platform links engineering, production and sites. Findings from the line flow back into design – and vice versa.
What you get.
The SonicTC history is the central test object and measurement data store. It links installations, archives audit-proof, and provides data for statistics, analyses and reports.
Central history
Test parts, results and metadata land audit-proof in a modern SQL database.
Audit trail & compliance
Seamless change history – meets the audit trail requirements of FDA 21 CFR Part 11, IEC 62304 and ISO 13485.
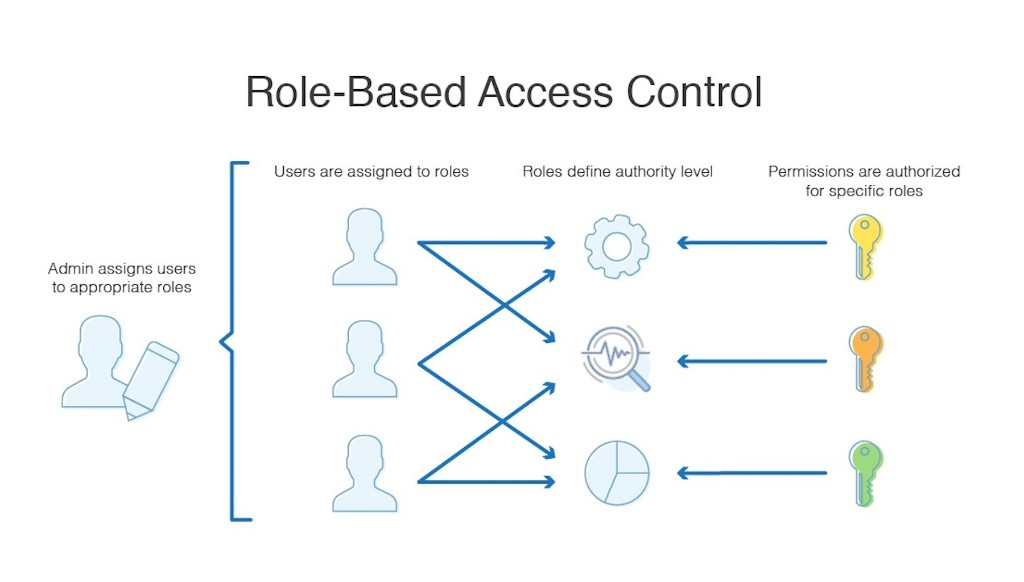
Role-based access
Operator, setter, engineer, QM, admin – everyone sees only what they need. Active-Directory-ready.
Identification & backup
Auto-ID via barcode, DMC or serial. Decade-long traceability. Automated backups.
Here is what it looks like.
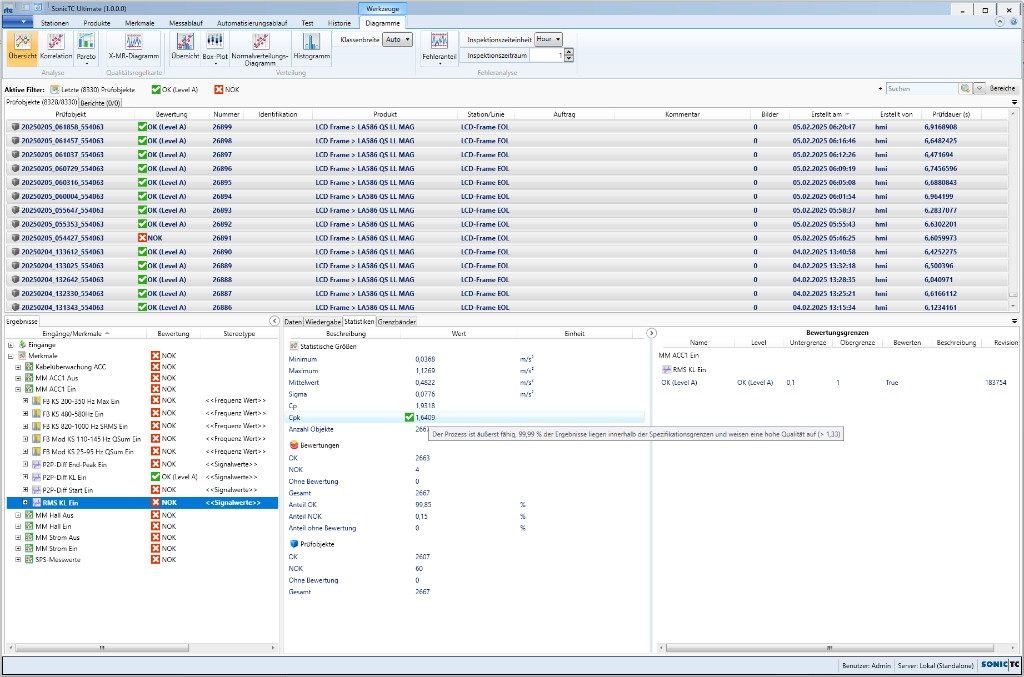
Process capability straight from the test software.
Cm/Cmk, Pp/Ppk and Cp/Cpk come out of the running test data – with no export into a second system.
Above a Cpk of 1.33 a process counts as capable. The evaluation shows position, spread and limits in one view and filters straight through to the parts concerned.
Statistics and quality management that run alongside.
Measurement system analysis
Cg, Cgk and Gage R&R check the measurement system first – without a capable gauge, any process control is worthless.
Process capability
Cm/Cmk for the machine, Pp/Ppk for pre-series, Cp/Cpk for the running process – each with guidance on how to read it.
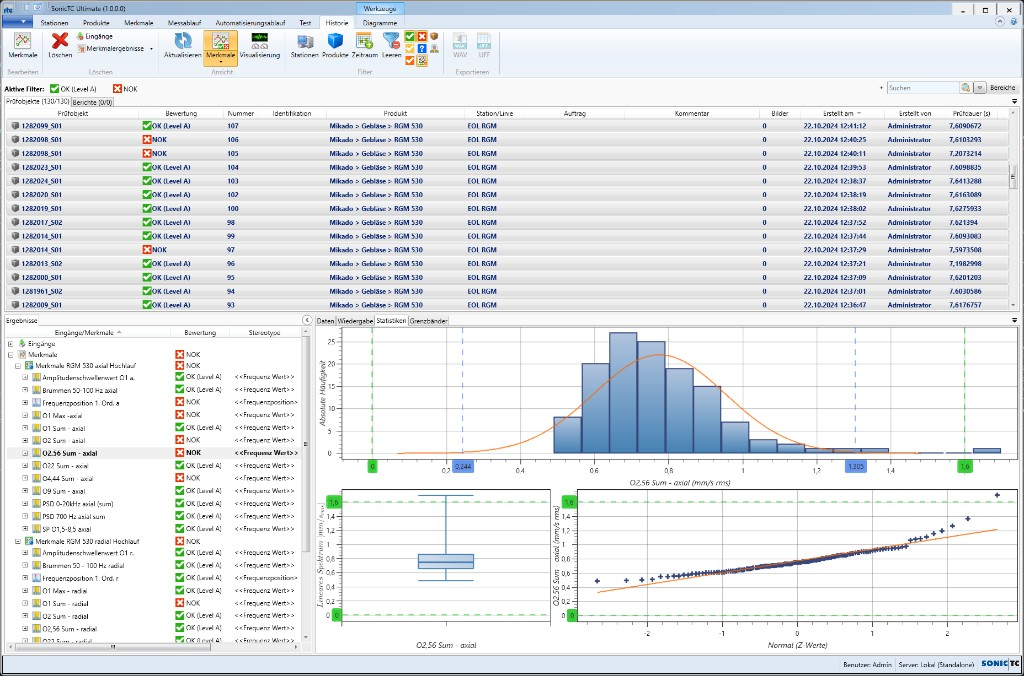
Data distribution
Histogram, box-whisker plot and Q-Q chart show whether the assumption of a normal distribution holds at all.
Control charts
The X-MR chart separates individual value and moving range – process position and process spread get judged separately.
Pareto analysis
Roughly 80 % of defects come from 20 % of causes. The filter leads from the bar straight to the parts concerned.
Defect analysis
The Laney p′ chart corrects over- and under-dispersion and avoids false alarms with large sample sizes.
Correlation analysis
The Pearson coefficient from −1 to +1 reveals relationships between characteristics – correlation explicitly remains no causation.
Ready to experience acoustic test technology in your line?
Send us your part or schedule an online demo. First assessment within 24 hours.